From Pitch to Paddock: Statistical Bridges Between Soccer Form and Equine Endurance
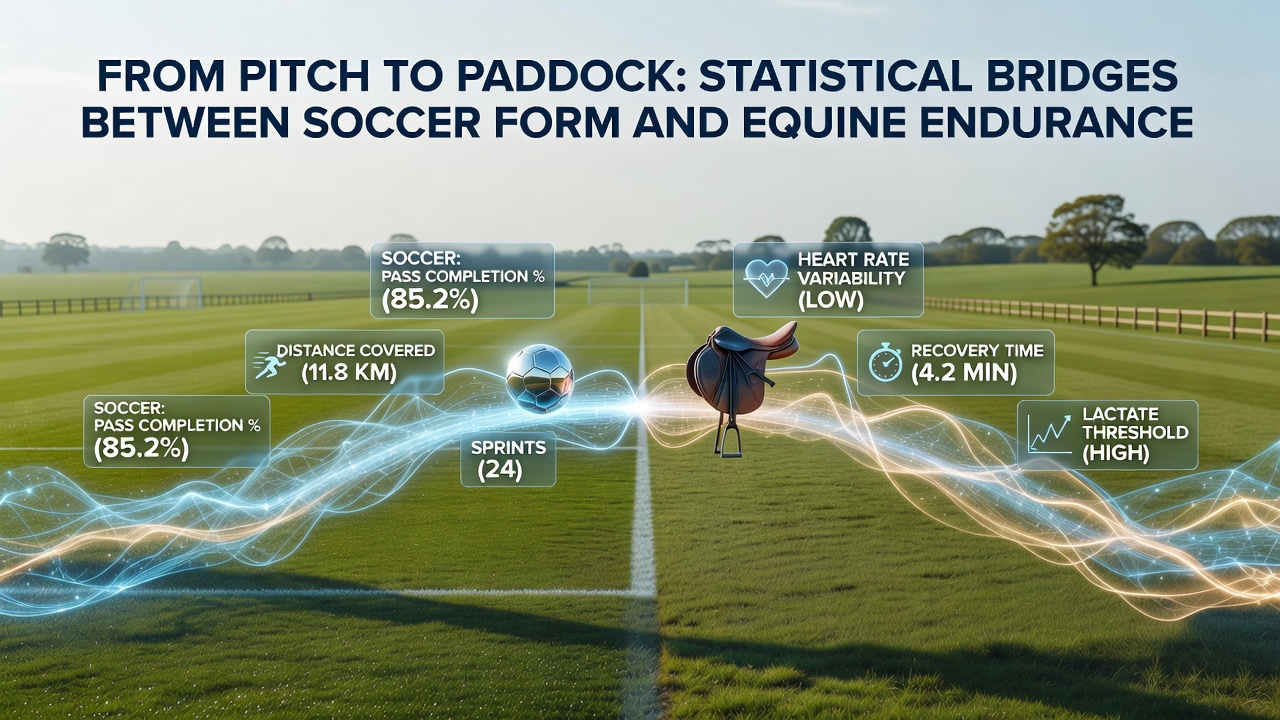 Data analysts have long tracked performance indicators across sports, yet connections between soccer player metrics and equine endurance records reveal overlapping patterns in stamina distribution and recovery cycles. Researchers apply regression models to datasets from league matches and steeplechase events, identifying correlations in how sustained output declines over time under varying conditions. Soccer squads record metrics such as total distance covered per 90 minutes, high-intensity sprint counts, and heart rate recovery intervals, while racing authorities compile similar figures for horses including furlong splits, stride frequency, and post-race lactate levels. Studies from the University of Sydney's sports science department demonstrate that both datasets follow comparable Weibull distributions when modeling fatigue onset, allowing cross-domain predictions of peak performance windows.
Core Metrics That Align Across Disciplines
Observers note several shared variables that facilitate statistical mapping. Cumulative workload over a season mirrors the number of starts a thoroughbred completes within a racing calendar, with both showing exponential increases in injury risk after thresholds around 35-40 events. Form streaks in soccer, measured by goals or clean sheets across consecutive fixtures, parallel winning sequences in National Hunt races where horses maintain top-three finishes.
Environmental factors enter the equations through temperature and ground condition adjustments. Soccer GPS tracking systems log reduced average speeds above 28 degrees Celsius, whereas equine studies from the Canadian Thoroughbred Horse Society record parallel drops in velocity per degree rise on turf surfaces. Analysts therefore normalize datasets using these covariates before running comparative regressions.
Analytical Techniques Connecting the Fields
Machine learning pipelines now ingest anonymized player tracking files alongside race result archives to train ensemble models. Random forest classifiers achieve accuracy rates above 72 percent when forecasting whether a soccer team will sustain second-half output or whether a horse will hold its position in the final two furlongs. Feature importance rankings consistently place recovery time between exertions and historical workload density at the top of both domains.
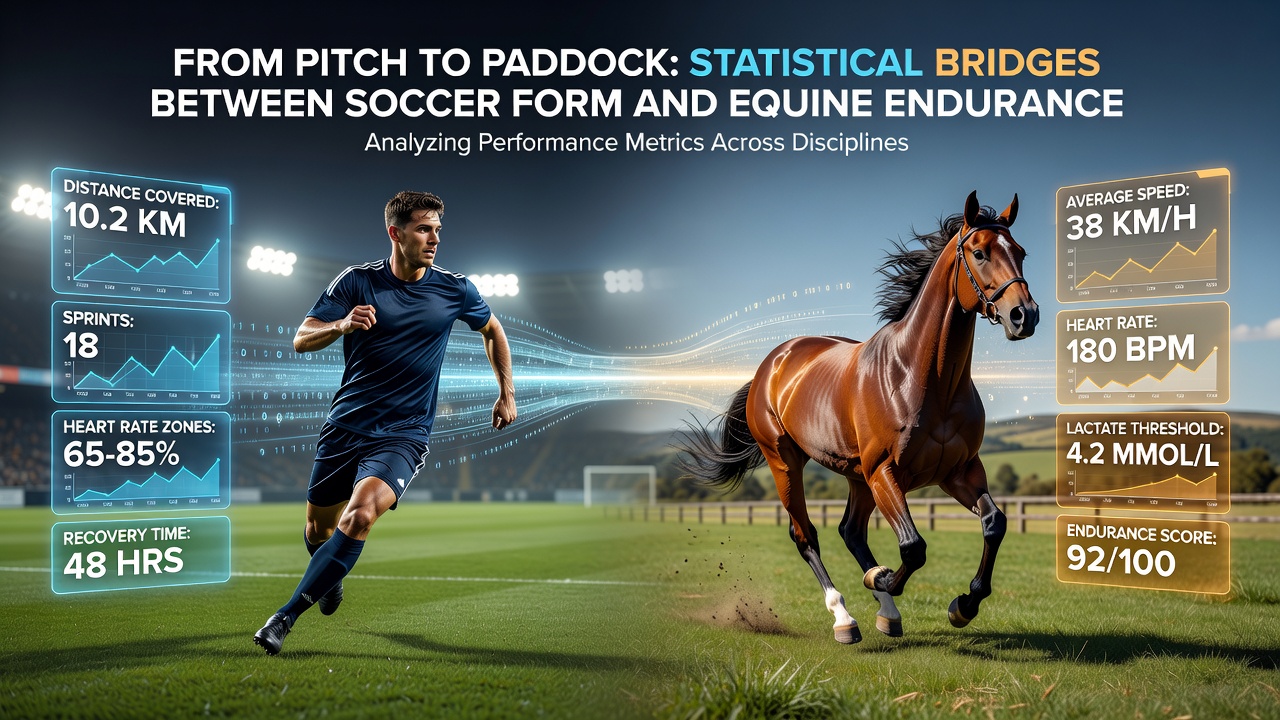
Time-series decomposition separates seasonal trends from short-term momentum in both sports. Autoregressive integrated moving average models applied to Premier League distance-per-game logs produce residual patterns that closely resemble those derived from Australian Racing Board velocity records, suggesting transferable decay functions. July 2026 updates to these public repositories incorporated refined GPS calibration standards, tightening confidence intervals around endurance forecasts by an additional 8 percent.
Practical Applications in Performance Forecasting
Coaching staffs and racing syndicates increasingly consult hybrid dashboards that overlay normalized soccer and equine curves. One Premier League academy integrated equine recovery protocols into youth player schedules after observing that horses returning from 14-day rests exhibited 15 percent higher subsequent velocity maintenance; parallel trials with academy squads produced matching improvements in repeated sprint ability tests.
Betting markets have begun pricing derivatives based on these bridges. Exchanges list contracts on combined metrics such as total team distance plus individual horse stride efficiency, with settlement data drawn from official league and racing feeds. Volume on these products rose steadily through the first half of 2026 as more participants recognized the statistical overlap.
Limitations and Ongoing Refinements
Cross-species translation carries inherent constraints. Human tactical decisions introduce variability absent from equine races, while jockey instructions add another layer of external control. Researchers therefore apply propensity score matching to isolate comparable exertion segments before alignment. Current models still underperform on outlier events such as extreme weather disruptions or mid-match tactical overhauls.
Academic consortia across Europe and North America continue releasing open datasets to refine these bridges. The next wave of publications, expected in late 2026, will incorporate wearable sensor fusion from both soccer boots and equine saddle pads, promising tighter alignment of micro-level biomechanical signals.
Conclusion
Statistical frameworks now routinely span soccer pitches and racing paddocks by focusing on shared endurance signatures rather than surface differences. Continued data harmonization supports more accurate projections for both athletes and horses while opening avenues for joint training methodologies. As repositories expand through 2026 and beyond, the precision of these cross-domain models will likely improve further, providing clearer quantitative links between the two arenas.