From Starting Gates to Kickoffs: Parallel Metrics That Shape Betting Decisions Across Disciplines

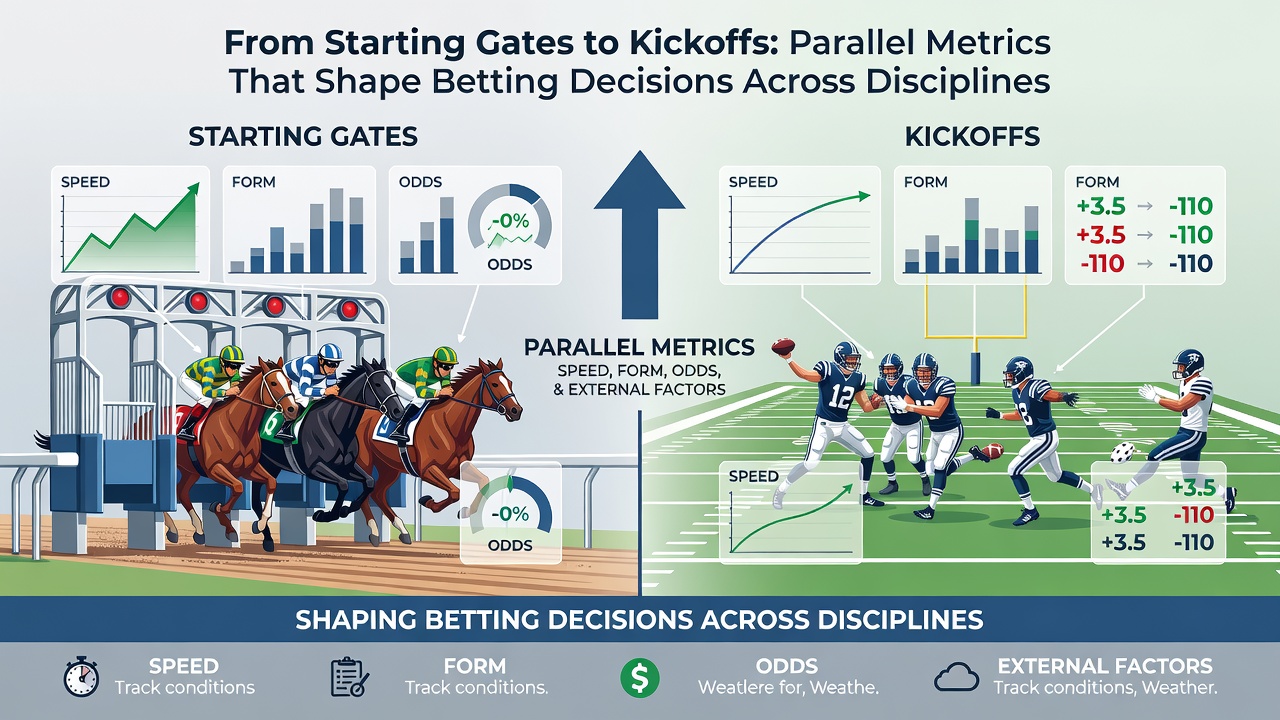
Betting markets across horse racing and football draw on overlapping sets of performance indicators that help shape decisions at the outset of each event, and analysts track these measures because they often forecast how contests unfold from the first stride or touch. Data collected from race records and match logs shows that early acceleration patterns, historical benchmarks under comparable conditions, and participant-specific trends provide consistent reference points whether the focus rests on thoroughbreds leaving the stalls or teams advancing from kickoff.
Early Acceleration and Position Metrics
Gate speed figures compiled by racing authorities align closely with models that measure initial possession retention and territorial gain after kickoff in football, because both capture the advantage gained in the opening seconds when momentum shifts prove decisive. Researchers at institutions such as the University of Sydney’s sports analytics program have documented how horses posting the top sectional times in teh first 200 metres frequently convert those advantages into place finishes, while parallel studies of European football leagues reveal that clubs securing early territorial dominance within the opening three minutes record elevated scoring rates over full matches. Bettors incorporate these figures into pre-event calculations because the numbers establish baselines that adjust odds once live data streams confirm whether the projected trajectory holds.
Historical Benchmarks Under Matched Conditions
Form databases maintained by racing organisations and football analytics firms store results filtered by surface, distance, and weather variables, allowing direct comparisons between a horse’s record on firm ground after a recent layoff and a team’s away performance following similar rest intervals. Figures released in June 2026 by Canadian gaming regulators indicated that handicappers who weighted such conditional histories achieved more stable long-term returns than those relying solely on aggregate win percentages, and the same pattern appears when football models isolate matches played under identical temperature and pitch-state parameters. Observers note that these layered filters reduce variance because they isolate repeatable elements rather than isolated outliers.
Participant-Specific Trends and Jockey-Player Parallels
Jockey strike rates on particular tracks mirror the value placed on striker or midfielder consistency within defined pitch zones, since both represent repeatable execution under pressure. Aggregated season data from Australian thoroughbred boards demonstrates that riders maintaining above-average win percentages at specific distances continue that edge across subsequent meetings, and comparable football datasets from North American professional leagues show forwards with elevated shot-conversion rates inside the penalty area sustain those outputs when tactical setups remain stable. Bettors cross-reference these micro-trends because adjustments to starting lineups or declared riders often trigger immediate market recalibrations.
Integration of Environmental and Track Variables
Weather and surface reports feed into both racing and football models because moisture levels alter footing and ball behaviour in measurable ways, and regulatory filings from Australian state racing commissions confirm that adjusted times posted on rain-affected tracks produce reliable offsets when applied to future events. Football analysts apply similar corrections for matches contested on waterlogged pitches, where pass-completion percentages drop and set-piece conversion rises; data released through the European Professional Football Leagues association illustrates these shifts across multiple seasons. Market participants therefore monitor forecast updates in tandem with form because the combined inputs refine probability estimates before the starter’s flag or referee’s whistle.
Statistical Modelling Approaches Shared Across Markets
Regression frameworks and machine-learning outputs now underpin odds compilation in both disciplines, and reports from the Canadian Centre for Gaming Research highlight how multivariate inputs that include early-speed indices and conditional form generate tighter confidence intervals than single-factor approaches. The same methodology transfers to football because possession-transition metrics and expected-goal differentials follow comparable distributional patterns. Operators adjust lines when fresh inputs deviate from model projections, and this feedback loop keeps pricing responsive throughout the day of competition.
Conclusion
Parallel metrics drawn from starting-gate and kickoff phases continue to anchor analytical frameworks because they supply verifiable early signals that persist across full events, and ongoing data releases from international racing and sports bodies ensure these indicators remain calibrated to current conditions. Bettors who integrate acceleration figures, conditional histories, and environmental corrections therefore operate with reference points that span both paddock and pitch.